NOrthwest Earthquake Study
In 2015, The New Yorker published an article called The Really Big One, a terrifying tale of the Cascadian Subduction Zone (CSZ) and the destruction it will one day bring to the Pacific Northwest (PNW). The article itself is big on anecdotes and explanations of the what and the why the CSZ will wreck such havoc, but light on the reality of what the Really Big One would mean for communities in the PNW. This study is a response to that article, a deep dive into the why, where, what, and how the CSZ will impact Oregon, Washington, and Southern British Columbia, with a particular focus on the city of Portland, Oregon.
This project is also an examination of how massive global processes shape where we live, how we live, and how those processes can affect the lives of those in a single community.
PLATE TEctonics

Plate Tectonics is a scientific theory that describes how the various large and small plates of the Earth’s Lithosphere move and the various seismic forces and events that impact our planet and communities. The map above shows the boundaries of all known and suspected tectonic plates which have been defined by zones of seismicity. This seismicity manifests in different ways depending on the type of fault in a given area.
Fault Types
There are three main fault types associated with plate boundaries: Divergent, Convergent, and Transform faults. Divergent boundaries are found where plates are moving away from each other, creating a rift. These faults are usually found in oceanic ridges and are not a major source of seismic activity. The other two faults are of much greater concern.

Convergent Boundary
A convergent boundary is formed when two tectonic plates slide towards each other and collide. In the event of an oceanic plate colliding with a continental plate, the much denser oceanic plate will slide below the continental plate creating a subduction zone. Subduction zones are responsible for the creation of the majority of the world’s volcanoes, and can lead to catastrophic earthquakes, such as the one predicted for the PNW.

As the image above illustrates, most volcanoes form near subduction zones. More specifically volcanoes form in subduction zones when the subducting plate enters into the magma of the mantle and melts. This new magma finds its way back to the surface through cracks and forms volcanoes. Good examples of the process can be found at the subduction zone in Chile, the Cascadian Volcanoes in Northern California, Washington, and Oregon, and the volcanoes that make up the ring of fire.
The ring of fire
The Ring of Fire is the colloquial name for the most seismic and volcanically active regions of the world. Forming a rough ring of volcanoes and seismically active areas around the Pacific Ocean extending in the north from Alaska and Kamchatka all the way south to southern Chile and New Zealand, the Ring of Fire accounts for the vast majority of the world’s earthquakes and volcanoes, including most of the world’s most powerful earthquakes and volcanic eruptions. Most of the Ring of Fire is the result of the Pacific Plate interacting with the neighboring plates, with powerful subduction zones on the northern, western, and northeastern regions. In North America, the Cascadian Subduction Zone and the resulting Cascadian Volcanoes are part of the Ring of Fire, as is the San Andreas fault in California and line of volcanoes that starts in mainland Alaska and extends out through the Aleutian Islands to the west.

The Ring of Fire can be seen here as the near-continuous ring of volcanoes around the Pacific Ocean.
This animation shows 6 months of earthquakes with magnitudes of 5 or greater per frame in the Ring of Fire, starting January 1, 1990 and ending on December 31, 2019. Earthquakes are sized by magnitude: the bigger the circle the stronger the earthquake. This animation helps illustrate that while the entire Ring of Fire is quite active, the majority of activity occurs on the Asian side of the ring. So while the West Coast of the US has the potential for seismic activity, it is less common than other parts of the Ring of Fire.
The Pacific northwest
There are many definitions for the geographical area of the region known as the Pacific Northwest. Most definitions include Idaho in addition to Oregon, Washington, and Southern British Columbia, but for this study Idaho is not a focus due to its distance from the CSZ. Roughly 15.3 million people call the PNW home, with Seattle, Portland, and Vancouver BC as the primary population centers.

Population density map of Oregon, Washington, and British Columbia. Each dot represents 10 people, and lighter colors indicate denser populations.
The PNW is a region shaped by the tectonic forces of the Ring of Fire. The Cascade Range runs from Southern British Columbia to Northern California and is the most clear physical evidence for the Cascadian Subduction Zone. The Cascade Range is riddled with active volcanoes that formed by the subduction of the Juan de Fuca plate under the North American Plate, and the non-volcanic mountains of the Cascades are the result of volcanic build-up from thousands of smaller no longer existent volcanoes. The Cascade Range marks areas on the surface of the Earth where the Juan de Fuca plate subducting is causing the mantle above to melt and create an area of high volcanic activity.

This Digital Elevation Map of Washington State shows the affect of the Cascadian Subduction Zone. The Cascade Mountain Range is clearly visible, and the active stratovolcanoes of Washington are labeled.
Seismic PAcific Northwest

In 1980, Mount Saint Helens, a 9,677 foot-tall stratovolcano in Southern Washington erupted after a 5.1 magnitude earthquake near the volcano caused a landslide which allowed the pressurized and partly molten steam-and-gas-rich rock inside the volcano to explode outwards. 57 people were killed by the eruption, 100’s of square miles of forest were reduced to wasteland, and ash fell across 11 states. The eruption of Mount Saint Helens was the most significant seismic event in the PNW in recent memory, but it wont be the last.
There are thousands of known and assumed to exist faults in the PNW. Most of them are small and not of any concern. Some are more concerning, and capable of producing up to 6+ magnitude earthquake, such as the Portland Hills Fault. Most, if not all, of them are the result of the Cascadian Subduction Zone, and the ‘crumpling’ of the North American plate over the Juan de Fuca plate.
Cascadian Subduction Zone
The map to the left shows the known fault lines in Washington and Oregon along with populated areas. The large mass of north-to-south faults in the Pacific Ocean indicates the boundary of the North American plate where it is colliding with the Juan de Fuca plate.
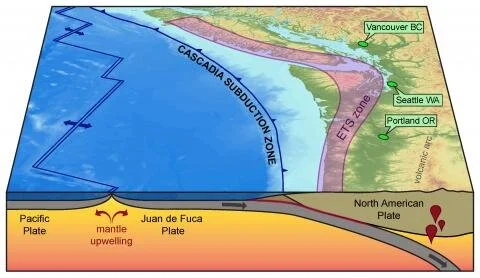
All of these faults are the result of the North American plate grinding against Juan de Fuca plate. The image above shows how the Juan de Fuca plate is subducting under the North American plate, leading to magma upwelling which creates the volcanoes in the Cascades.
Portland, Oregon

Portland with Mt. Hood, an active stratovolcano from the Cascadian Subduction Zone. Credit: Truflip99, CC BY-SA 4.0
Portland, OR is the second largest city in the PNW, with a 2018 estimated population of over 650,000. Portland is a major port city and the vast majority of Oregon’s petroleum and gasoline products are brought in through the Port of Portland. The port is also the primary wheat port in the United States.
Buildings Codes
Portland, like many American cities is relatively low density. And like many American cities it has a relatively large number of unreinforced masonry buildings, a primary concern in the event of an earthquake as they are most vulnerable to collapse. The State of Oregon requires a seismic upgrade to any unreinforced masonry buildings when the occupancy rating of the building changes. For example, if an owner of an unreinforced masonry office building remodels the building and changes its occupancy rating, that landlord is required by law to upgrade the building to current seismic standards. New construction is less of a concern in a seismic event, as all new construction must meet state and federal seismic regulations.


This maps of land use classes highlights the housing density across Portland and the prevalence of unreinforced masonry buildings. Most of the city area is taken over by single-family residences. This is important from an earthquake risk perspective as single family residences are of minor concern in the event of a catastrophic earthquake. Where large apartment buildings, especially those built in the first half of the 20th century, have the potential for disaster in a large earthquake, single-family residences which are mostly wood-framed pose much less risk. Wood-framed buildings perform well in an earthquake and there is minimal collapse risk. However, there is the possibility for a wood-framed house to be dislodged from its foundation, which can rupture natural gas lines and start fires. Thankfully, the lower density in areas dominated by single-family residences can minimize fire spread.
Illustrating what land use class the unreinforced masonry buildings that have not received seismic upgrades lie in is important to understanding the potential for devastation should an earthquake occur and unreinforced masonry buildings collapse. The majority of the non-upgraded unreinforced masonry buildings in Portland are located in commercial zones, which makes them more risky to the population during business hours. However, there are significant areas of the city with non-upgraded unreinforced masonry buildings that are primarily occupied by multi-family residences, a risk that should be acknowledged.

These two charts illustrate the unreinforced masonry building stock in Portland. Very few unreinforced masonry buildings have received a seismic upgrade, but a larger relative percentage of unreinforced masonry buildings 3 stories or taller have been upgraded. This is good since taller buildings pose a greater threat.
Risk
In the event of a catastrophic Cascadian Subduction Zone earthquake, what would happen to Portland, and the people who live there? What level of damage is possible and expected? How does the city react? The following visualizations address these questions, they are based on research and data from the Oregon Department of Geology and Mineral Industries (DOGAMI) that was prepared for the Regional Disaster Preparedness Organization (RDPO). All of the visualizations are based on modeling for a 9.0 magnitude Cascadian Subduction Zone earthquake in dry conditions, as opposed to saturated conditions, such as those after heavy rain.
Population density and Population displacement


This series of maps illustrates population density in Portland, and then the percentage of the population that would be displaced in the event of 9.0M earthquake.
Building loss

Building loss data from DOGAMI is presented as a percentage dollar amount. The amount is the percentage of the total cost to rebuild all the buildings in each polygon. The areas with 20 - 35% building loss in the center of the city are the result of an abundance of URM buildings. The polygons with a building loss percentage higher than 35% are landfill areas and are highly susceptible to liquefaction during a seismic event, which can be catastrophic.
URM buildings
Statistically, the ratio of URM buildings (the percentage of buildings in a neighborhood that are non-retrofitted URM buildings) is strongly correlated with the negative effects of a Cascadia earthquake. Specifically, the higher percentages of URM buildings are correlated with higher amounts of displaced people, higher critical injuries and fatalities, more debris and building loss, and more completely destroyed buildings. Because of this, it behooves jurisdictions in seismically active areas to address their stock of URM buildings. Doing so will save lives. If you’d like to read a statistical paper on this topic, please follow the link below.
Data Citations:
Ahlenius, Hugo. Tectonic Plate Boundaries. SHP. Retrieved April 10, 2020, from https://github.com/fraxen/tectonicplates
American Geologic Survey. Volcanoes of the World. SHP. Retrieved April 1, 2020, from https://earthworks.stanford.edu/catalog/harvard-glb-volc
Bauer, J. M., Burns, W. J., & Madin, I. P. (n.d.). DOGAMI Open-File Report Series. Retrieved May 8, 2020, from https://www.oregongeology.org/pubs/ofr/p-O-18-02.htm
City of Portland, Oregon Open Data. (2020, February 5). Unreinforced Masonry (URM) Buildings. SHP. Portland. from http://gis- pdx.opendata.arcgis.com/datasets/unreinforced-masonry-urm-buildings
City of Portland, Oregon Open Data. (2019, December 30). Buildings Footprints. SHP. Portland. from http://gis-pdx.opendata.arcgis.com/datasets/buildings
Multnomah County, Oregon Open Data. (2017, January 14). Taxlots. SHP. Portland. Retrieved from http://gis-multco.opendata.arcgis.com/datasets/10bbca2553634733ba59634bffcfdeb2_0
U.S. Census Bureau. American Community Survey, 2017 American Community Survey 5-Year Estimates, Table B01001 for WA, OR. Generated by Zachary Walker using American FactFinder. 30 January 2020
U.S. Department of Agriculture. National Elevation Dataset, 30M for OR, WA. GeoTIFF. Retrieved April 3, 2020 from https://gdg.sc.egov.usda.gov/GDGOrder.aspx
U.S. Geologic Survey. ANSS Comprehensive Earthquake Catalog (ComCat). GeoJSON. Retrieved February 1, 2020 from https://earthquake.usgs.gov/fdsnws/event/1/ using the search API.